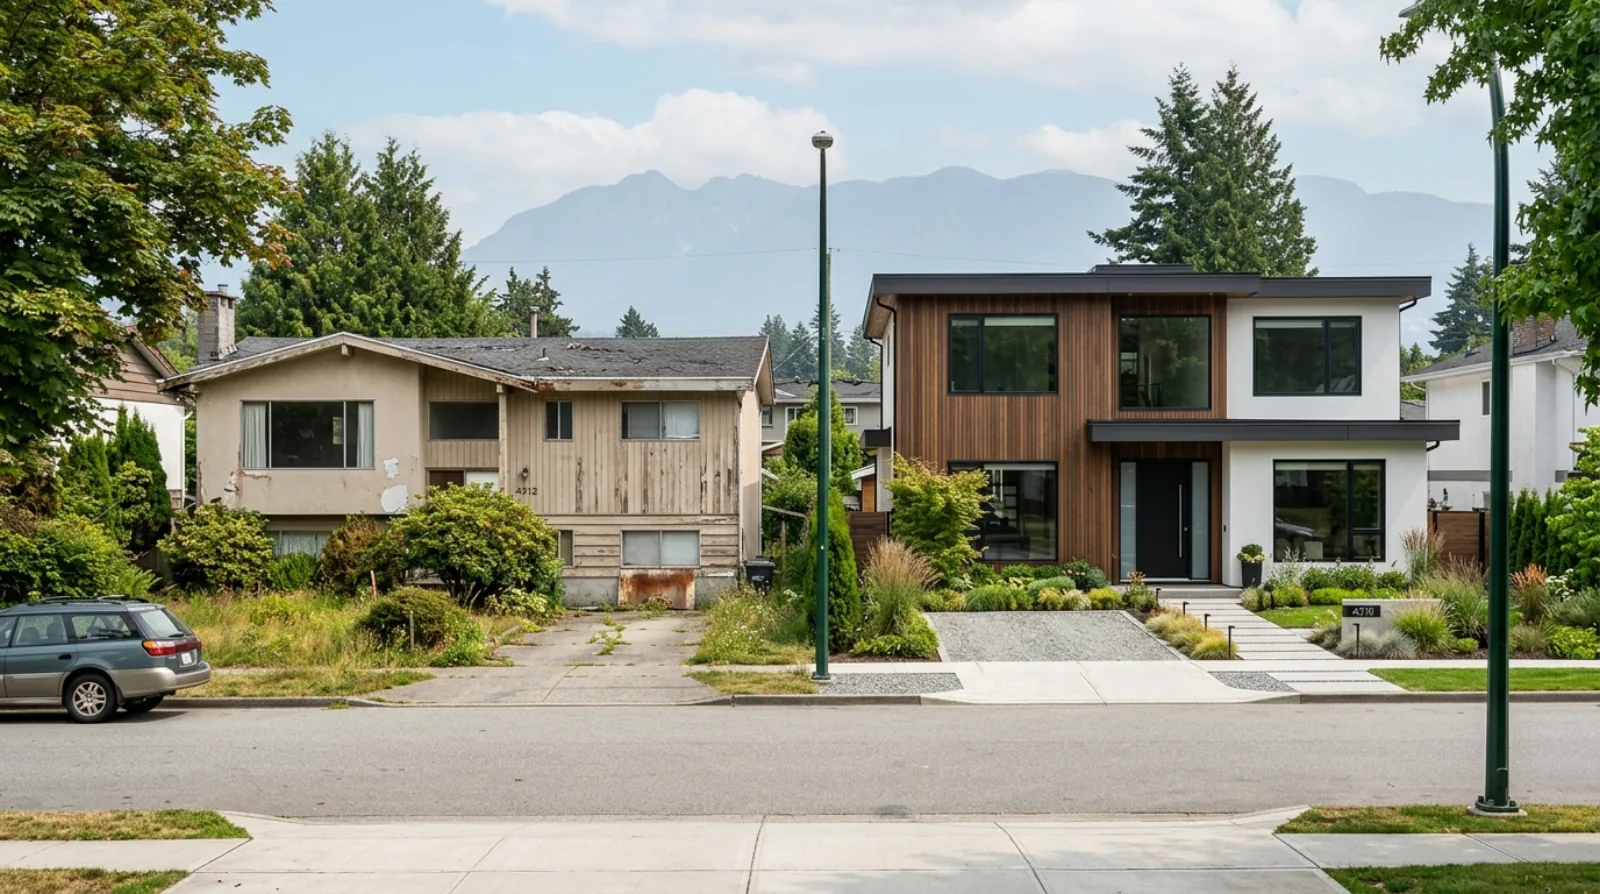
The June numbers landed this week, and one line in them stopped me. For the first time in longer than I can remember, home sales across the Greater Vancouver region were up year-over-year in every property type at once — detached, townhouse, and apartment all sold more units than they did in June 2025. That kind of broad, across-the-board gain hasn't happened in years. Andrew Lis, the chief economist at Greater Vancouver Realtors, put it plainly: "June saw a pattern of broad gains in home sales across all home types relative to the same time last year, which has been a rare occurrence in recent years."
So more people bought. Here's the part that matters just as much, though: prices didn't move. The composite benchmark is down about 6% from a year ago and essentially flat compared to May. More buyers showed up, and they bought at prices that are still softer than last summer. That gap — demand returning while prices sit still — is the whole story this month, and it changes what I'd tell you to do depending on which side of the table you're on.
I'll say up front what I always say: one strong month is not a trend. But it's the first month in a while that gave the "market is bottoming" argument something real to stand on.
The June 2026 Numbers at a Glance
These are Greater Vancouver (Metro Vancouver) region-wide figures from the GVR June 2026 report. Burnaby is part of this region and tracks closely, but individual Burnaby neighbourhoods and buildings vary.
| Metric | June 2026 | Change |
|---|---|---|
| Total residential sales | 2,390 | +9.6% YoY · −12.4% vs 10-yr avg |
| Detached sales | 747 | +13.7% YoY |
| Townhouse sales | 527 | +11.4% YoY |
| Apartment sales | 1,103 | +6.1% YoY |
| New listings | 5,938 | −6% YoY · +5.9% vs 10-yr avg |
| Total active listings | 17,017 | −3.1% YoY · +30.2% vs 10-yr avg |
| Sales-to-active ratio | 14.6% | Detached 12% · Townhouse 17.8% · Apt 15.5% |
| Composite benchmark | $1,099,100 | −6% YoY · −0.1% MoM |
Source: Greater Vancouver Realtors, June 2026 (MLS® HPI).
The Sales Bounce Is Real — the Price Bounce Isn't
Look at how even the sales gains were. Detached led at +13.7%, townhouses at +11.4%, apartments at +6.1%. It's unusual for all three to rise together, because they usually trade on different buyers and different pressures. When they all move the same direction in the same month, it tells you the reason is broad — something affecting everyone, not one segment. My read is that it's a full year of Bank of Canada rate stability finally giving buyers who were sitting on their hands the confidence to act.
But now put the benchmark prices next to those sales gains:
| Property type | Benchmark price | YoY | MoM |
|---|---|---|---|
| Detached | $1,842,900 | −7.1% | −0.3% |
| Townhouse | $1,046,200 | −5.0% | −0.2% |
| Apartment | $695,200 | −7.1% | −0.4% |
Source: GVR June 2026 MLS® HPI.
Every one of those prices is down year-over-year, and every one is a hair lower than May, not higher. So the extra buyers who showed up in June did not bid prices up. They bought the softness. That's the honest picture: demand is returning, but there's still enough inventory that buyers set the terms. Lis himself framed June as a "could be" rather than a "did" — his words were that the data "could be an early sign of a shift in the market." I agree with the hedge. A shift in sales volume shows up months before a shift in price, if it shows up in price at all.
What the Sales-to-Active Ratio Actually Tells You
This is the one number I'd watch above all the others, because it's the cleanest read on which way prices are likely to lean over the next month or two. GVR's own rule of thumb: when the ratio of sales to active listings sits below 12% for a sustained stretch, prices tend to face downward pressure; above 20%, upward pressure; in between is balanced.
June came in at 14.6% overall — squarely in balanced territory, and higher than the sub-12% readings we saw through the softest stretch of the past year. But the average hides a real split underneath it:
- Detached: 12% — right at the bottom edge of balanced. Detached is still the softest segment on price, even though its sales jumped the most. More detached homes sold, but there are still so many on the market that the ratio barely cleared the downward-pressure line.
- Townhouse: 17.8% — the firmest of the three, and getting close to seller's-market territory. This matches what I'm seeing on the ground: family buyers priced out of detached but unwilling to live in an apartment are competing hardest for well-located townhomes.
- Apartment: 15.5% — balanced, steadier than a year ago, though it's the segment with the most listings to work through.
If you want the shorthand: townhouses are where competition is heating up, detached is where a patient buyer still holds the cards, and apartments sit in between.
Inventory Is Still the Ballast
Here's the fact that keeps this from being a runaway recovery story. Active listings finished June at 17,017 — that's down 3.1% from a year ago, but it's a striking 30.2% above the 10-year seasonal average. There are roughly 4,000 more homes on the market right now than a normal June would carry.
That inventory is the reason prices didn't move even as sales climbed. When there's a deep pool of homes to choose from, no single buyer has to stretch, and no single seller can hold out for last year's number. New listings actually came in below last June (−6%), so sellers aren't flooding the market — but the backlog that built up over the past year is still being worked through. Until that active-listing count comes back toward its normal range, I'd expect prices to stay roughly where they are, give or take the usual monthly noise. Buyers keep the negotiating leverage that elevated inventory hands them.
The Rate Backdrop
The Bank of Canada held its policy rate at 2.25% on June 10, 2026 — the fifth consecutive meeting with no change (Bank of Canada, June 10 2026). The Bank Rate sits at 2.5% and prime at most lenders is around 4.45%. Competitive five-year fixed mortgages have settled into the low-to-mid 3% range.
That stability is, I think, the quiet engine under June's sales bounce. Buyers spent 2024 and early 2025 waiting for rates to stop moving so they could underwrite a payment with confidence. They now have five straight holds to plan around. The next decision comes July 15, 2026 — worth watching, but I wouldn't expect one meeting to change the picture. Predictability has done more for demand this spring than any single cut would. If you want to understand how the stress test still shapes what you can borrow at these rates, I walked through it in the Burnaby mortgage stress test guide.
For Buyers: The Easy Window Is Narrowing, Not Closed
For most of the past year I've told buyers they had time and leverage, and to use both. That's still mostly true — 17,017 active listings and a 12% detached ratio don't lie. But June is the first month I'd add a caveat: the competition is picking up, especially in townhouses.
- Townhouse buyers, tighten up your process. At a 17.8% ratio, the well-located, honestly-priced ones are moving, and you can't take three weeks to circle back. Get your financing pre-approved, know your comparable sales cold, and be ready to write when the right one lists. This segment is the closest thing to competitive in Burnaby right now.
- Detached buyers, you still hold the cards. Sales jumped, but the ratio says supply is still deep. This is the segment where patience keeps paying — target listings that have already had a price reduction, and don't let anyone manufacture urgency. If you're weighing the trade-offs against a townhouse, detached vs. townhouse in 2026 lays out the math.
- Everyone: prices haven't moved, so you're not "buying the top." Benchmarks are flat-to-down month over month. There's no penalty for taking the week you need to inspect properly and run your real closing costs — the transfer tax and closing cost breakdown is where I'd start.
For Sellers: More Buyers Are Looking — but They're Still Price-Sensitive
The good news is genuine: more buyers walked through doors in June than in any June for years, across every property type. If you were waiting for demand to come back before listing, some of it just did.
The catch is that those buyers bought at prices that are down year-over-year. They showed up; they did not overpay. So the seller playbook hasn't changed — it's just that a correctly-priced home now has a real audience.
- Price to the June comps, not to 2024. A detached home that fetched a certain number two years ago needs a current, honest 2026 number. With detached sitting at a 12% ratio, an aspirational price still means 60-plus days of sitting while a well-priced neighbour sells.
- Townhouse sellers have the most momentum. If you're selling a townhome in a good pocket, this is the firmest segment in the region. Price it right and prepare it properly, and you may see the kind of competition that's been missing elsewhere.
- If your lot could be a multiplex, run both buyer types. Some Burnaby detached lots have an end-user family and a developer pricing the land under Bill 44's multiplex rules at the table. That changes your pricing and marketing. The full decision framework is in sell, hold, or redevelop.
Looking Ahead to July
Here's what I'm watching to decide whether June was a genuine turn or a one-month blip:
- Does July hold the sales gains? One month of broad gains is interesting; two in a row starts to look like a floor. If July sales also beat last year across all types, I'll get more confident that demand has genuinely re-based.
- Does the active-listing count start to fall? At 30% above the 10-year average, inventory is the thing keeping prices flat. If that number drops through the summer, prices could firm. If it holds, they won't.
- The July 15 Bank of Canada decision. Another hold keeps the current rhythm. I don't expect fireworks, but it's the next scheduled input.
My honest read: June was real, and it's the best evidence yet that the softest part of this cycle is behind us. But "sales are up" and "prices are rising" are two different milestones, and we've only cleared the first. I could be wrong, and one good month won't convince me on its own — but it's the first data in a while that's pointed up instead of sideways. For the longer view, I laid out my full second-half 2026 outlook separately.
Key Takeaways
- Sales rose across the board. Total June sales hit 2,390, up 9.6% year-over-year, with detached (+13.7%), townhouse (+11.4%), and apartment (+6.1%) all gaining — a rare, broad move.
- Prices didn't follow. The composite benchmark is $1,099,100, down 6% year-over-year and 0.1% month-over-month. Detached ($1,842,900), townhouse ($1,046,200), and apartment ($695,200) are all lower than a year ago.
- The overall market is balanced at a 14.6% sales-to-active ratio, but it splits: townhouse is firmest at 17.8%, detached softest at 12%, apartment in between at 15.5%.
- Inventory is the ballast. Active listings of 17,017 sit 30.2% above the 10-year average, which is why more buyers didn't push prices up.
- Rates are steady. The Bank of Canada held at 2.25% on June 10 for a fifth straight meeting; the next decision is July 15, 2026.
- Buyers still have leverage, especially in detached — but townhouse buyers should move faster than they did last winter.
- Sellers have a real audience again if they price to current comps; aspirational pricing still sits.
Frequently Asked Questions
What was the Metro Vancouver benchmark price in June 2026?
The MLS® Home Price Index composite benchmark for all residential properties in Metro Vancouver was $1,099,100 in June 2026 — down 6% year-over-year and 0.1% from May, per the GVR June 2026 report. By type, the detached benchmark was $1,842,900 (−7.1% YoY), the townhouse benchmark $1,046,200 (−5% YoY), and the apartment benchmark $695,200 (−7.1% YoY). Burnaby is part of this region and tracks closely, but specific neighbourhoods and buildings vary.
Are Burnaby home sales rising or falling in June 2026?
Rising, and across every property type. Total Greater Vancouver residential sales reached 2,390 in June 2026, up 9.6% from June 2025. Detached sales rose 13.7%, townhouse sales 11.4%, and apartment sales 6.1%. It was the first month in years with broad year-over-year sales gains in all three segments at once, though sales were still 12.4% below the 10-year seasonal average.
What is the Bank of Canada's policy rate as of July 2026?
The Bank of Canada's policy (overnight) rate is 2.25%. It was held there on June 10, 2026 — the fifth consecutive meeting with no change — with the Bank Rate at 2.5%. The next scheduled interest rate decision is July 15, 2026.
Is it a buyer's or seller's market in Burnaby right now?
Balanced overall, with the balance tilting by segment. June's sales-to-active listings ratio was 14.6% region-wide — inside the balanced band (roughly 12% to 20%, per GVR). The detached segment at 12% still leans toward buyers, townhouses at 17.8% lean toward sellers, and apartments sit in the middle at 15.5%. With active listings 30% above the 10-year average, buyers retain negotiating leverage in most of the market.
Sources
- Greater Vancouver Realtors — June 2026 Monthly Market Report (benchmarks, sales, listings, sales-to-active ratios, Andrew Lis quotes)
- Bank of Canada — Policy Interest Rate Decision (June 10, 2026)
Related Guides
- Buying a Home in Burnaby — complete 2026 guide: First-time programs, condo vs townhome, due diligence, and which neighbourhood fits your plan.
- Selling a Burnaby Home — complete 2026 guide: Pricing with a CMA, what selling actually costs, and when to list in 2026.
---
If you want to know what your specific Burnaby home is worth in this market — not the regional benchmark, your actual address — I'll give you a straight read: a current price range, the comparable sales behind it, and an honest view of which kind of buyer your property attracts right now. Get a no-obligation valuation or reach out directly. — Jersey Li, PREC, Sutton Group — 1st West Realty

Sutton Group — 1st West Realty · Medallion Club Member (Top 10%)
Burnaby real estate advisor and multiplex strategist. Licensed REALTOR® with Sutton Group — 1st West Realty, specializing in residential, multiplex, and redevelopment transactions across Burnaby and Metro Vancouver.